
Blog Post 0
In this post I will be giving a tutorial on how to use Python to make an interesting scatterplot from the Palmer Penguins dataset. This dataset contains information about 344 penguins and we will create a scatterplot that compares the flipper length and body mass of the penguins based on their species.
Setup
First, we will import the necessary libraries and load in our data. We will be using pandas to read the data and then we will use seaborn and matplotlib to create our scatterplot.
import pandas as pd
import seaborn as sns
from matplotlib import pyplot as plt

url = "https://raw.githubusercontent.com/PhilChodrow/PIC16B/master/datasets/palmer_penguins.csv"
penguins = pd.read_csv(url)
Creating the visualization
We will use the seaborn library to create our scatterplot. The scatterplot function takes arguments for the data structure and the variables that will serve as the x and y axis. Here, the data frame penguin will be used as the data argument. The x variable will be the flipper length and the y variable will be the body mass.
sns.scatterplot(data = penguins, x = "Flipper Length (mm)", y = "Body Mass (g)")
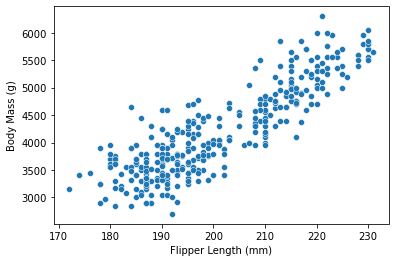
This looks nice so far, we can see that there is a positive correlation between the flipper length and body mass of the penguins. Now, let’s see how the flipper length and body mass of the penguins is related to their species. There are 3 species of penguins in the dataset, and we will use the hue argument to have each species appear in its own color on the scatterplot.
sns.scatterplot(data = penguins, x = "Flipper Length (mm)", y = "Body Mass (g)", hue = "Species")
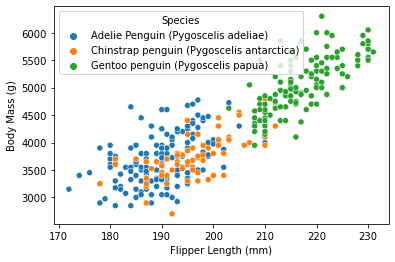
Nice! Now each species is represented in its own color. We can see that in general the gentoo penguin appears to have the greatest flipper length and body mass while the Adelie and chinstrap penguins are quite similar in this regard.
To make our visualization more clear, let’s move the legend to the side of the plot so it is not covering the points. Furthermore, we will add a title to our scatterplot.
plt.legend(bbox_to_anchor=(1.05, 1),loc=2)
plt.title("Body Mass vs. Flipper Length in Adelie, Chinstrap, and Gentoo Pengions")
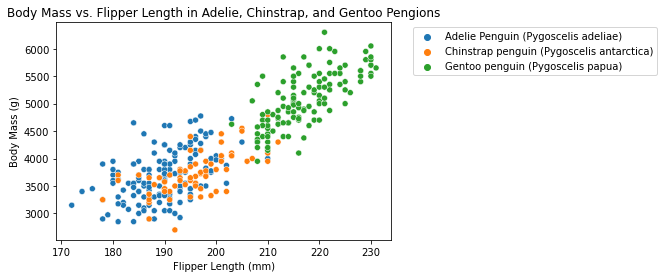
And there you have it! We just created a scatterplot comparing the flipper length and body mass of three species of penguins.
Stay tuned for more exciting posts this quarter!
Full code for reference
import pandas as pd
from matplotlib import pyplot as plt
import seaborn as sns

url = "https://raw.githubusercontent.com/PhilChodrow/PIC16B/master/datasets/palmer_penguins.csv"
penguins = pd.read_csv(url)

sns.scatterplot(data = penguins, x = "Flipper Length (mm)", y = "Body Mass (g)", hue = "Species")
plt.title("Body Mass vs. Flipper Length in Adelie, Chinstrap, and Gentoo Pengions")
plt.legend(bbox_to_anchor=(1.05, 1),loc=2)